Reports View
EDIS allows your site to control access to the Reports view in several ways. For example, your site can deny access (in which case you dont see the Reports selection on the applications left-hand menu). It can also enable you to run, view, and print eleven standard reports, and allow you to export them for use in spreadsheet applications such as Microsoft Excel. (Sites control user access to EDIS’s export feature via the EDPR EXPORT security key.)
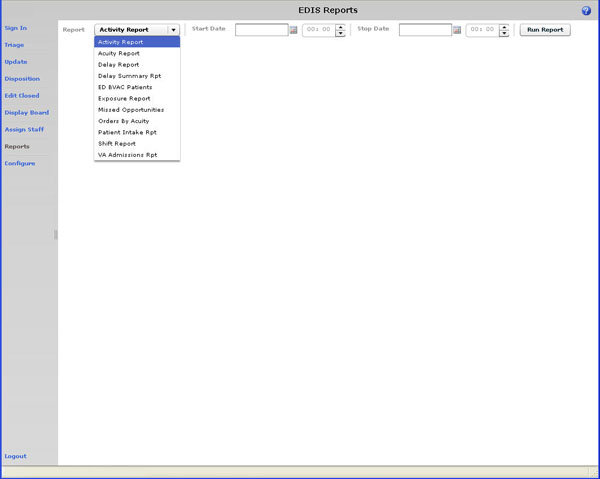
The Reports view Report list.
EDIS’s eleven standard reports are data grids that include one or more of the following columns:
The EDIS TWG provided the following abbreviations for nationally released dispositions; EDIS reports use these abbreviations when space is limited:
VA |
Admitted to VA Ward |
AMA |
AMA |
CL |
Sent to Urgent Care Clinic |
D |
Deceased |
E |
Eloped |
ERR |
Patient Name Entered in Error |
H |
Home |
ICU |
Admitted to ICU |
L |
Left Without Being Treated/Seen |
NEC |
Sent to Nurse Eval / Drop-In Clinic |
PSY |
Admitted to Psychiatry |
T |
Admitted to Telemetry |
NVA |
Transferred to Non-VA Facility |
O |
Transferred to VA Facility |
Activity Report: for each patient whose visit falls within the date and time range you select, this report lists available information in the following columns:
In addition, this report provides averages for several important time-based measurements (Admission Decision, Admission Delay, Elapsed, Wait, and Triage) in several patient categories:
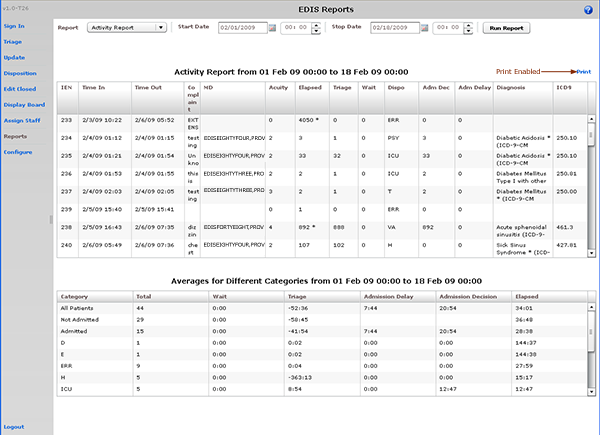
The Activity report.
Acuity Report: this report displays statistics that measure patient workload for each acuity level. For the date and time range you select, statistics show the number of patients who fell into each acuity category, the number of patients in each category who were admitted, and the number in each category who were admitted to a VA facility. The Acuity report also provides the following average times for patients in each acuity category:
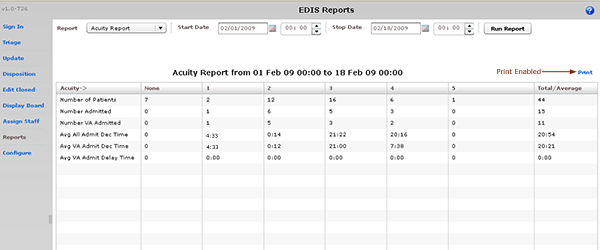
The Acuity Report.
Test sites found that this report times out for date ranges that cover a large number of visits (1,400 visits within a one-month range, for example). They recommend clicking Continue and toggling between the Display Board and Reports views to get data from extended time ranges.
Delay Report: this report presents information about patients whose emergency department stays exceeded the nationally recognized limit (six hours or 360 minutes). For each patient whose stay exceeded this limit, the Delay report displays available information in the following columns:
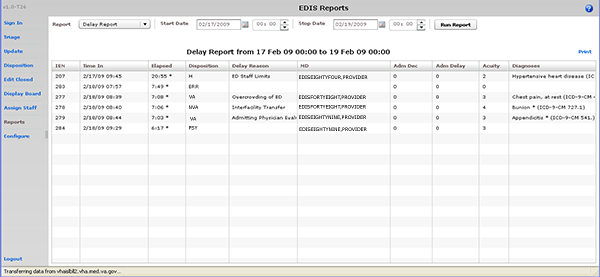
The Delay report.
| Note: | EDIS does not include in its Delay and Delay Summary reports patients whose emergency-department visits are not yet closed—regardless of the number of hours their visits have consumed. |
Delay Summary Report: this report presents average visit and decision-to-admit times (and other important information) for the following three visit categories:
This report also presents acuity-based tallies for each applicable reason for delay.
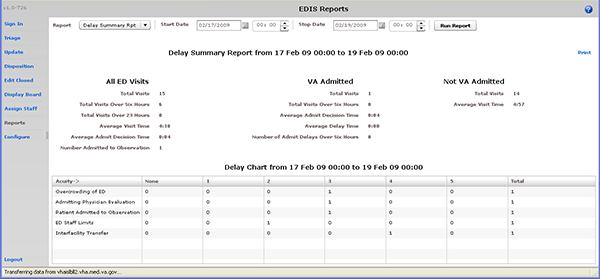
The Delay Summary report.
ED BVAC Patients: the ED BVAC (Emergency Department Behavioral VA Care) Patients report captures the following information for behavioral-health patients:
This report also provides service-related information such as whether or not the patient is a Vietnam veteran, has been exposed to Agent Orange, has a VA pension, and so forth.
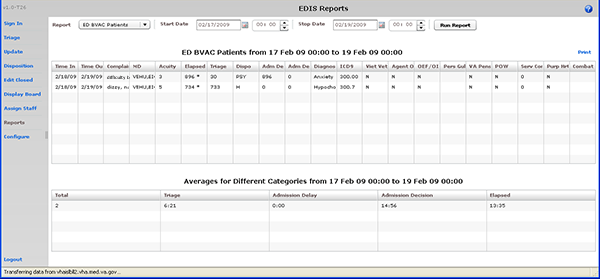
The ED BVAC Patients report.
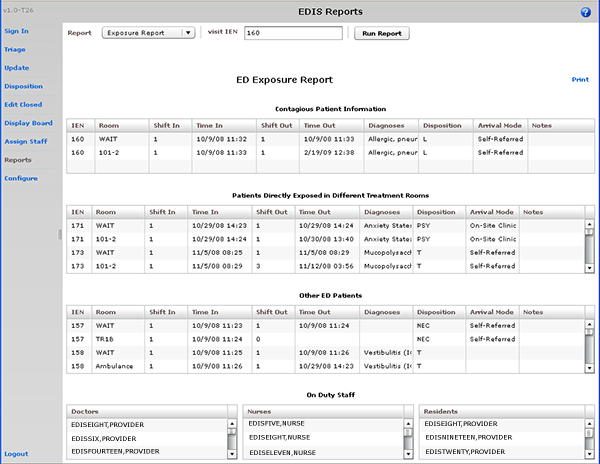
The Exposure report.
Missed Opportunities Report: this report displays the following information about patients whose disposition is AMA (left against medical advice), L (left without being treated or seen), or E (eloped):
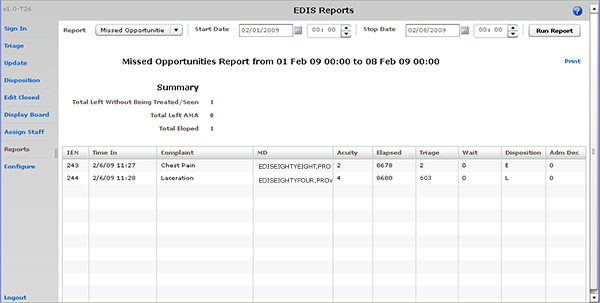
The Missed Opportunities report.
Orders by Acuity: for each acuity, this report tallies the number of medication, laboratory, imaging, consultation, and other orders emergency department staff placed within the date and time range you specify.
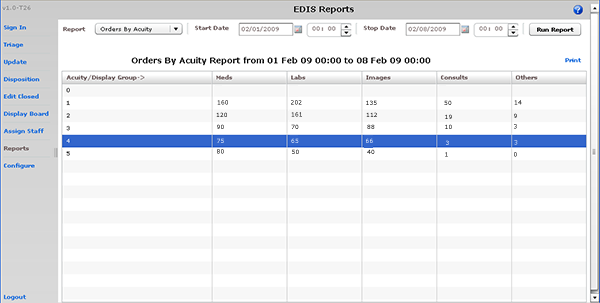
The Orders by Acuity report.
Patient Intake Report: the Patient Intake report provides time-of-day and day-of-week statistics about the number of patients who visited the emergency department during the date and time range you select.
Columns that report day-of-week tallies cover the entire time and date range against which you run the report. For example, if the date range you enter includes two Tuesdays, the intersection of the Tue column and the 0700-0800 row will display the total number of patients who visited the emergency department on both Tuesdays between the hours of 7:00 a.m. and 8:00 a.m. The Total column contains a sum of all daily totals across each time-based row. For example, in the 0700-0800 row, the Total column contains a sum of daily totals from the Sun through Sat columns.
For each time-based row, the Avg/Day column presents an average that is based on the figure in the Total column and the total number of days in the date range you select. For example, if your date range is January 1, 2009 through January 31, 2009, the total number of days (the denominator) will be 31.
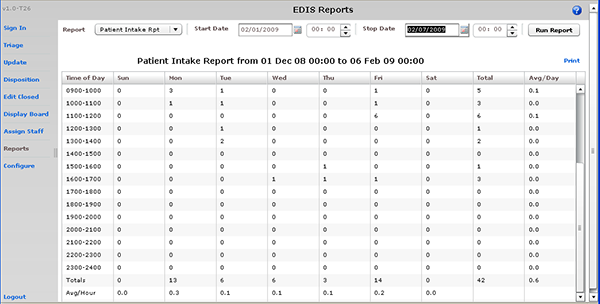
The Patient Intake report.
The Patient Intake report does not include maximum, minimum, and mean calculations.
Shift Report: this report presents a shift-based calculation of the following categories:
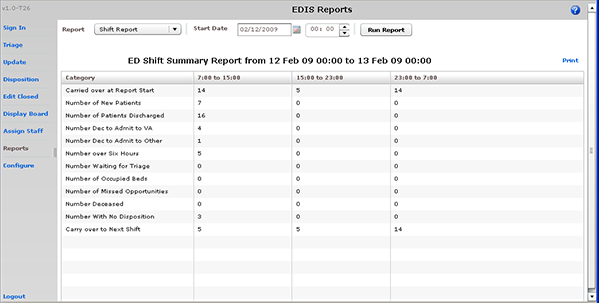
The Shift report.
VA Admissions Report: this report uses disposition entries to identify patients who were admitted to VA facilities (VA wards, intensive care units [ICUs], telemetry, and observation wards, for example) during the time and date range you specify.
The report contains available information in the following columns:
The report also provides averages for patients who fall into each applicable VA admission category.
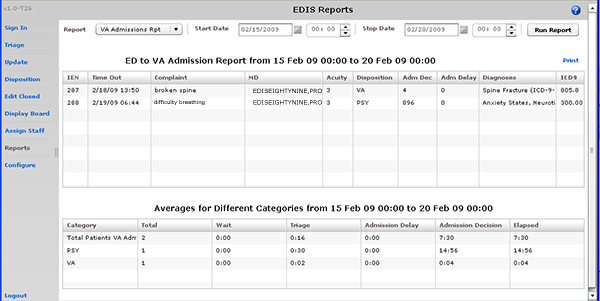
The VA Admissions report.
Cross Reference and Provider Reports
EDIS also provides two non-standard (restricted) reports: the Patient XRef (Cross Reference) and Provider reports. Because these two reports contain personally identifying information, you need special security keys (in VistA) to access and run them.
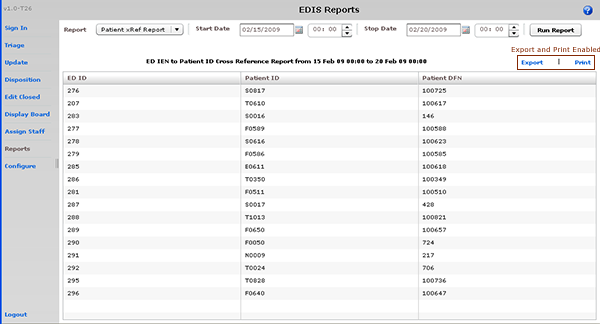
XREF: this report provides a cross reference between the EDIS IEN and patient identifiers (including patients surname initials concatenated with the last four digits of their social security numbers [SSNs]). The report also includes patients DFNs, which are the IENs in VistA’s Patient file (#2).
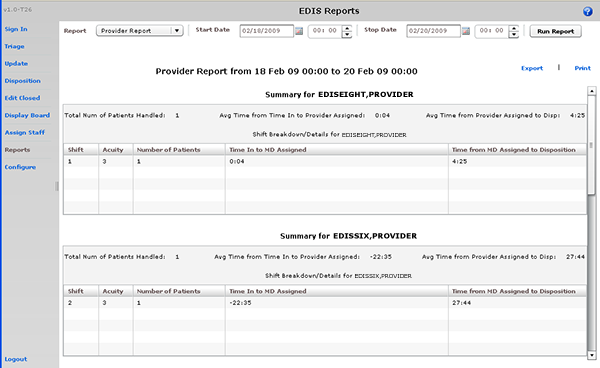
The Patient XRef (Cross Reference) report.Provider: The Provider report lists the total number of patients each provider saw during the date and time range you specify. It also provides a by-shift and by-acuity count of patients, the time between each patient’s emergency-department check in and his or her diagnosis, and the time between each patients provider assignment and his or her disposition.
The Provider report.
Note: If the Provider reports MD Assign to Dispo(sition) column contains only zeros, your site probably doesn't require providers to enter a disposition before releasing patients.
If your reports contain negative numbers, the problem could lie with logic that EDIS’s reports functionality inherited from the class-three Syracuse application. Syracuse reporting logic assumes that users will enter information in a certain sequence. For example, the application assumes that users will assign a provider before entering a patient’s disposition. To calculate the time that elapsed between a patient’s provider assignment and disposition, the application subtracts provider-entry time from disposition-entry time. If users assign providers after they’ve entered dispositions, reports such as the Provider report will contain negative numbers.
Negative numbers can also be a result of not-so-careful data entry. For example, suppose a patient’s stay began on July 10 at 11:00 p.m. and ended on July 11 at 1:00 a.m. Further, suppose someone mistakenly removed this patient from the board at 11:55 p.m. When correcting this error, if the user corrects the patient’s time-out hour-and-minute value, but neglects to update the date value, the patient’s time-out value will be chronologically before his or her time-in value, and EDIS will calculate the patient’s stay at -22 hours.
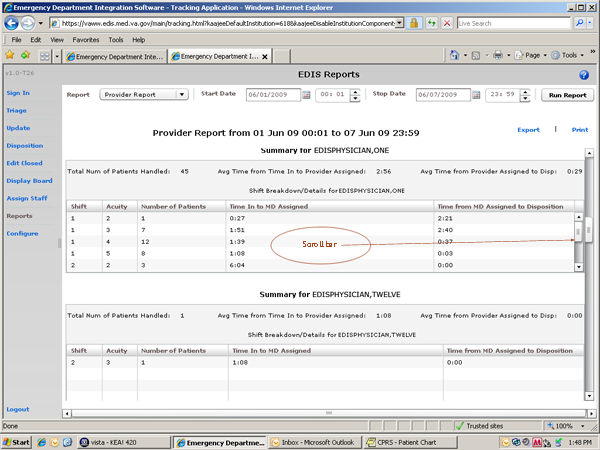
| Note: | When reports exceed your window’s viewing capacity, the application includes a scroll bar, as it does in the following screen capture:
|
To print a report, click Print. You can find the Print button in the upper right-hand corner of the Reports view. Keyboard: use the TAB key to locate Print and use the SPACEBAR key to select it. The application displays your operating system’s print dialog.
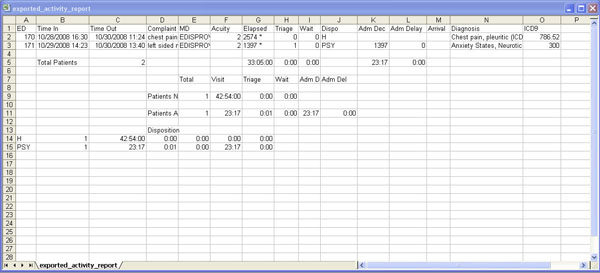
Exported Activity report in Microsoft Excel.